
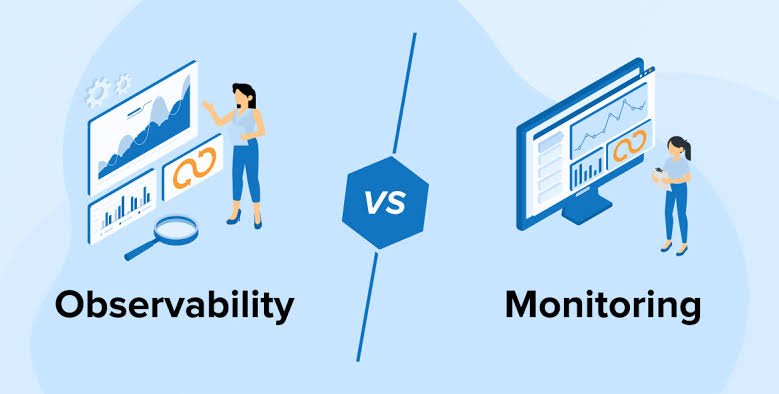
In cloud-native applications, Monitoring tells you when a system is failing, whereas Observability allows you to infer why it is failing by inspecting its internal state through telemetry data.
While monitoring tracks predefined metrics to catch known failure modes (“known unknowns”), observability provides the context needed to debug complex, distributed systems facing novel issues (“unknown unknowns”).
Key Architectural Differences
| Dimension | Monitoring | Observability |
| Core Goal | Detect pre-defined system failures and alert operators. | Debug complex system behavior and uncover root causes. |
| Problem Type | Targets Known Unknowns (e.g., high CPU, disk full, 500 error spikes). | Targets Unknown Unknowns (e.g., intermittent microservice latency under specific payloads). |
| Data Focus | Aggregated, predefined metrics and system health checks. | Rich, raw telemetry data correlated across distributed services. |
| Perspective | External view: Measures outputs and predefined performance indicators. | Internal view: Infers systemic state based on distributed telemetry. |
| Primary Action | Trigger alerts, update dashboards, notify on-call engineers. | Correlate traces, query unstructured data, perform ad-hoc root-cause analysis. |
The Three Pillars of Observability (MELT)
Observability relies on combining structured telemetry types—often referenced as MELT:
-
Metrics: Numeric, aggregated data values measured over time intervals (e.g., CPU utilization, memory usage, request counts). Metrics excel at triggering real-time alerts.
-
Events: Timestamped records of discrete occurrences within a system (e.g., deployment events, auto-scaling triggers, user sign-ups).
-
Logs: Immutable, time-stamped text records of specific events emitted by application code (e.g., error stack traces, execution paths).
-
Traces: End-to-end representations of a request’s path through a distributed microservices network. Distributed tracing (e.g., via OpenTelemetry) tracks latency across service boundaries using unique correlation IDs.
Why Cloud-Native Shifted the Focus to Observability
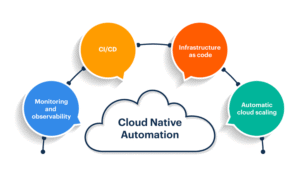
In traditional monolithic setups, monitoring a few servers, database connections, and memory heaps was sufficient.
Cloud-native environments—built on ephemeral Kubernetes pods, serverless functions, and asynchronous event buses—introduce massive complexity:
-
Short Lifespans: Container instances spin up and terminate in seconds, making static IP or server-based monitoring useless.
-
Cascading Failures: A network bottleneck in one service can manifest as a timeout three microservices away.
-
High Cardinality: Debugging requires querying data by dynamic attributes (e.g.,
user_id,container_id,region), which standard monitoring dashboards cannot efficiently query.